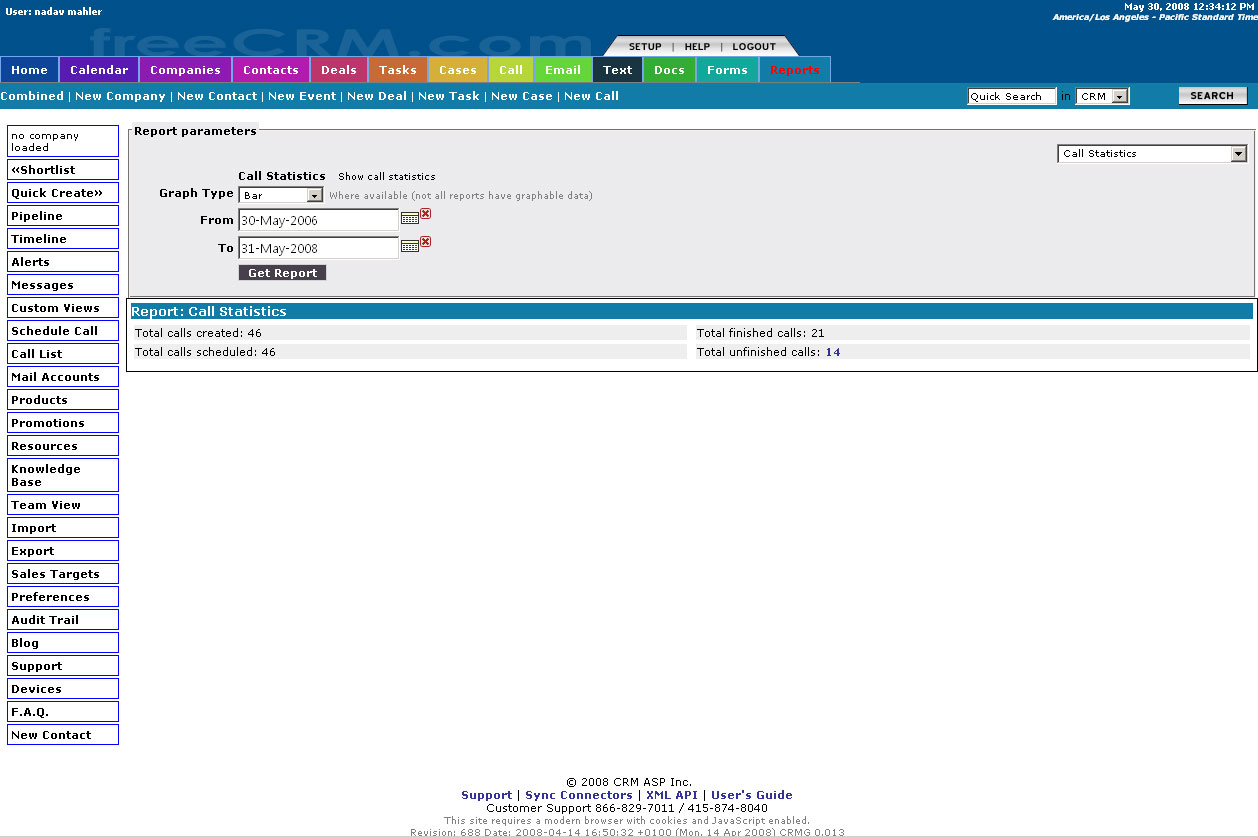
We provide real time reporting and analytics features to track and analyze your sales force automation and customer relationship management solution. You can set up custom reports and choose from a variety of colorful and informative graph types including pie, bar, line, and scatter plots, allowing you to quickly visualize and analyze the results of your sales and support activities.

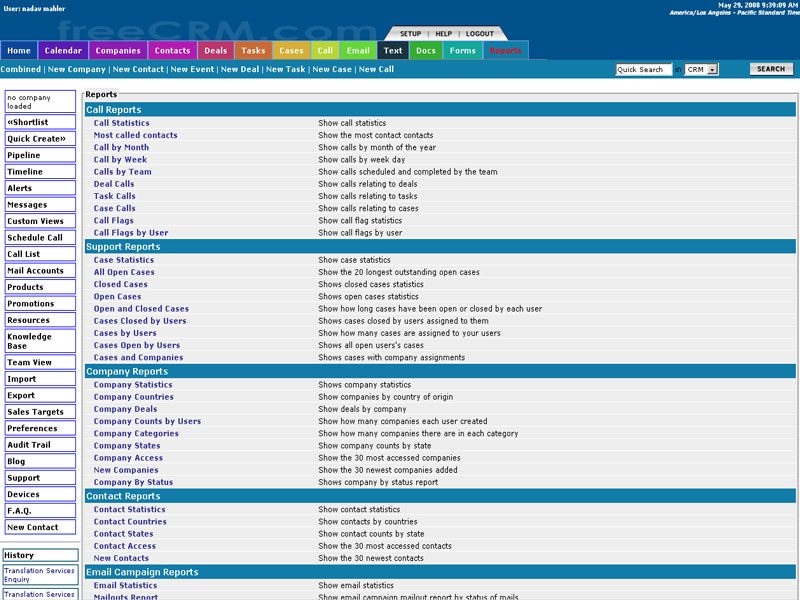
Choose from over 70 pre-defined reports
Our reporting features allow you to gauge the effectiveness of your CRM software solution and how well your sales staff is completing the sales cycle. You can also run reports that track system usage for each of your team members, allowing you to see where additional training is needed or extra customization in the application so that your team can use the tool more efficiently and easily as it pertains to your normal business operation.
Using the reporting functions, it is easy to get a complete picture of what is happening and how our CRM software is helping your company to achieve its goals.